About the course
One of the most important aspects of automation is making sure that everything works as expected. The Debugging in UiPath Studio course teaches you how to use the various debugging features including remote debugging offered by Studio to ensure your automations are production ready.
What you will learn in this course
By the end of this course you should be able to:
- List debugging actions and panels.
- Define remote debugging.
- Explain the functionalities of debugging actions.
- Explain the functionalities of debugging panels.
Debugging Features Overview
Debugging is a process of detecting and resolving errors in a project that would cause it to behave unexpectedly or crash. It is usually recommended to perform debugging during the design stage of the automation project, at the activity, file, and project levels.
Debugging actions

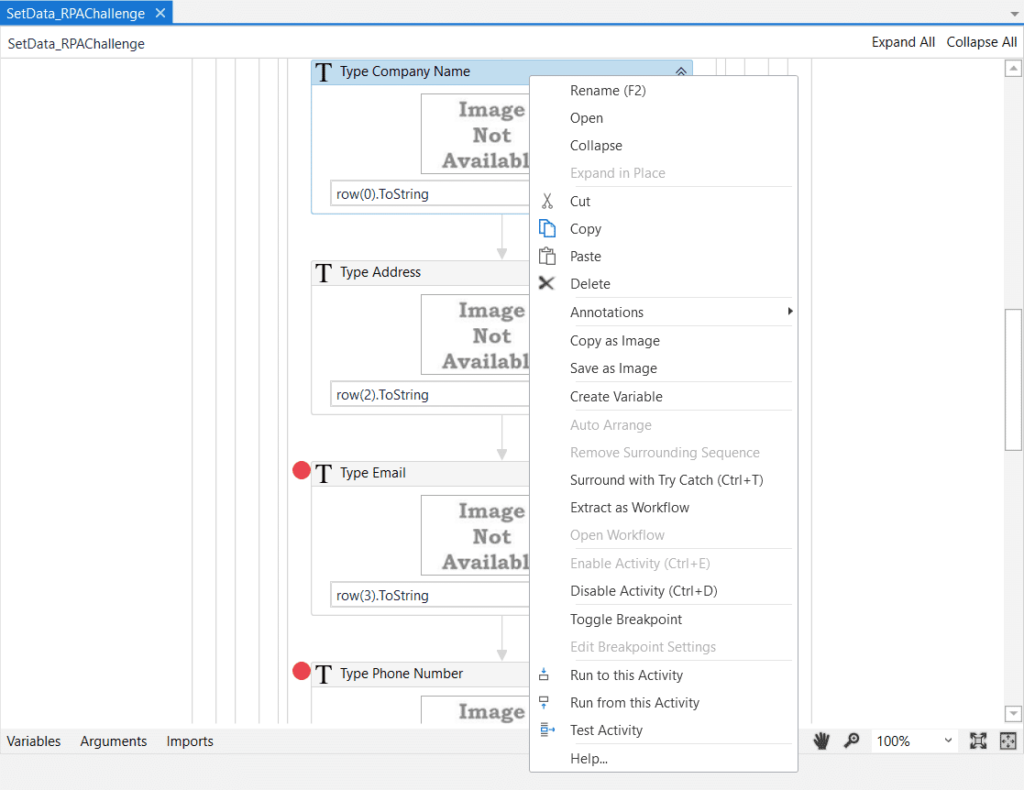
Three options are available for debugging while developing the workflow in the contextual menu for each activity: Run to this Activity, Run from this Activity, and Test Activity. In the image below, you can see the contextual menu for the Type Company Name activity.
Shortcut keys for the Debugging actions
Debug File (F6), Run File (Ctrl+F6), Debug Project (F5), Run Project (Ctrl+F5), Continue (F5 or F6), Stop (F12), Step Into (F11), Step Over (F10), Step Out (Shift+F11), Retry (Ctrl+Shift+R), Ignore (Ctrl+Shift+I), Restart (Shift+F5), Breakpoints (F9)

Run to this Activity: The Run to this Activity option is available when right-clicking an activity in the Designer panel. This option starts the debugging process and pauses before the selected activity is executed while highlighting it in the panel. If Run to this Activity is triggered when debugging is already paused, the execution continues until the activity is reached.
Run from this Activity: The Run from this Activity context menu option enters debugging in a pause state, allowing you to make changes to the values of variables and arguments from the Locals panel. Press Continue to start debugging or use actions such as Step Into, Step Over, and Step Out.
Test Activity: The Test Activity context menu option part of the Designer panel is used for running a test on the currently selected activity. Test Activity can be used in two ways:
- add default values to properties and test
- add arguments and/or properties to activity properties and use the Local panel to add values after clicking the Test Activity option.
Debugging panels

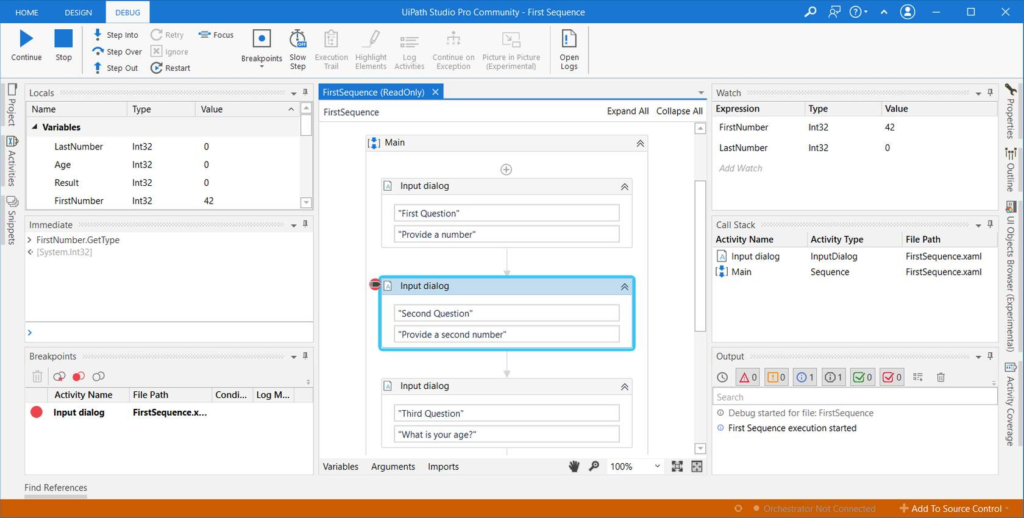
Locals: The Locals panel is only visible while debugging. The panel shows:
- Exceptions – the description and type of the exception.
- Arguments of the current activity
- Variables of the current activity
- Properties of previously executed activity – only input and output properties are displayed.
- Properties of the current activity
When debugging is paused, the properties of the current activity, the values of variables and arguments can be modified. Right-click an argument, variable or property of the currently executing activity to add it to the Watch panel and monitor its execution throughout the debugging process.
Immediate: The Immediate panel is only visible during debugging, and it can be used for evaluating variables, arguments, or statements and inspecting data available at a certain point during debugging. To do so, simply type the variable or argument name in the Immediate window and press Enter.
The Immediate panel keeps the history of previously evaluated statements, and they can be removed using the Clear All context menu option.
Breakpoints: The Breakpoints panel displays all breakpoints in the current project, together with the file in which they are contained. The Activity Name column shows the activity with the toggled breakpoint, while the File Path column displays the file and its location.
The Condition column displays conditions set to breakpoints. The Log Message column shows messages to be logged if the condition is met. Hover over the breakpoint tag on an activity to view its condition and log message.
Designer: In debug mode, the Designer panel displays the workflow, the breakpoints on activities and highlights the currently executed activity in yellow and an activity throwing an exception in red.
Highlight current action: In debug mode, the currently running activity is highlighted in the Designer panel. This also applies to actions on which the execution is paused.
Watch: Similar to the Call Stack panel, the Watch panel is only visible during debugging. It can be set to display the values of variables or arguments, and values of user-defined expressions that are in scope. These values are updated after each activity execution while debugging.
Call Stack: The Call Stack panel displays the next activity to be executed and its parent containers when the project is paused in debugging.
The panel is displayed during execution in debug mode and it gets populated after using Step Into, Break, Slow Step, or after the execution was paused due to an error or a breakpoint.
If during debugging, an activity throws an exception, it is marked in the Call Stack panel and the activity is highlighted in red.
Output: The Output panel enables you to display the output of the Log Message or Write Line activities, among other things. Exceptions for packages are also displayed in this panel.
From the Output panel, you can show or hide messages that have different log levels (errors, warnings) by clicking the buttons in the panel’s header. Double-clicking a message displays further details about it, with the option to copy information.
Facts
What is the type of breakpoint in the picture below?

Answer: Conditional breakpoint
…
You can check the current value of a complex expression in the Immediate Panel.
Answer: True
…
Which panel can be used to modify the properties of a current activity?
Answer: Locals
…
Press Ctrl+Space in an expression editor window in order to bring up the variables or suggestions for methods or properties.
…
Which panel displays the next activity to be executed and its parent containers when the project is paused in debugging?
Answer: Call Stack
…
Which panel is used to inspect data available at a certain point during debugging?
Answer: Immediate
…
What information can you follow in the Watch panel?
Answer: The values of variables or arguments, and the values of user-defined expressions that are in scope.
…
From which panels can you directly add variables to the Watch panel?
Answer: The Locals panel, The Variables panel, The Watch panel, The Arguments panel
…
What happens if you close a Test Bench tab without saving the workflow?
Answer: You lose your Test Bench workflow.
…
This type of tracepoint is a good replacement for using Log Message activity for debugging purposes.

Answer: True
…
Where can you find the Run from this Activity, Run to this Activity and Test activity actions?
Answer: In the activity contextual menu in the Designer panel.
…
What happens when you click an activity or container in the Call Stack Panel?
Answer: It focuses on that activity or container.
…
Which panel would you use to create a Test Bench?
Answer: The Activities panel
…
Considering the below breakpoints settings, when will the workflow execution be paused?

Answer: When it reaches the activity holding the breakpoint a second time and the row value in the “First Name” column contains “Alex”.
…
Which of the following are types of information you can find in the Locals Panel?
Answer: Exceptions, Properties of the current activity, Argument values, Variable values, and Properties of the previously executed activity.
…
Where will changing a variable in the Immediate Panel be reflected?
Answer: The Locals panel, The Watch panel, The further execution of the workflow in debug mode.
Congratulation

